Beauty Challenge Stats
We’d like to share some interesting Beauty Challenge stats with you. For some of those breakdowns, we can only go back as far as 2015 but we managed to get a few charts that account for the entire run of the challenges too.
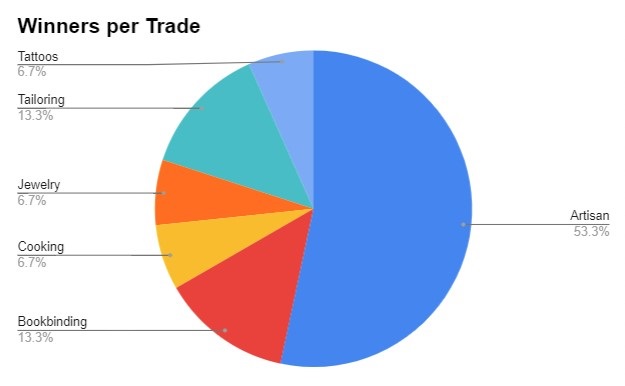
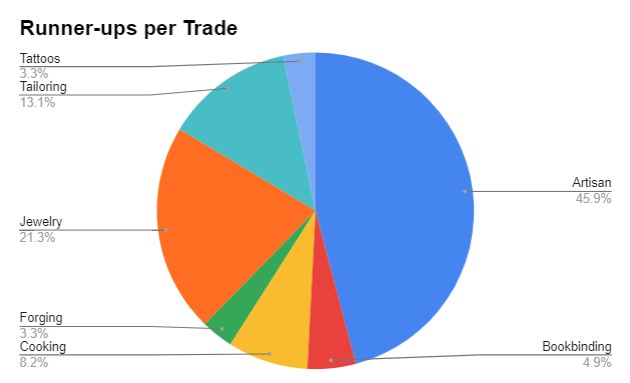
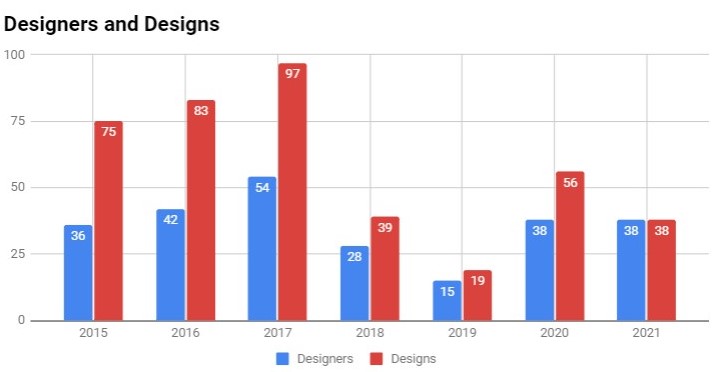
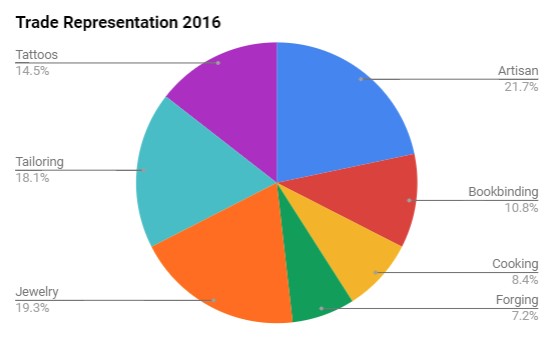
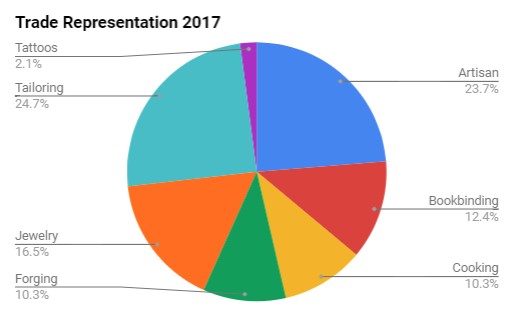
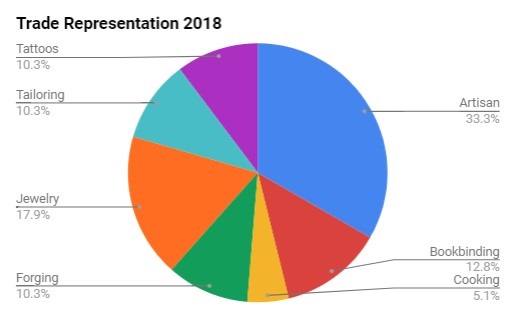
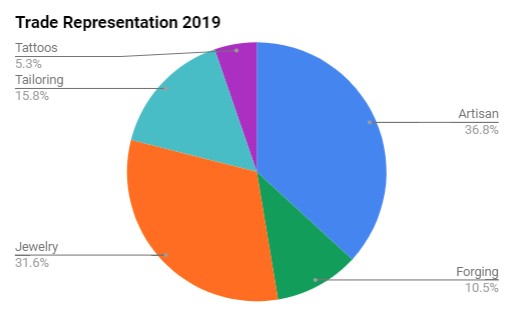
One of the things that we have heard over the years is that Artisan designs always win and so, that it is the best trade to submit for. But that seems to be a bit of a self-fulfilling prophecy. Artisan design submissions have increased significantly over the years, so it’s no wonder those do better. It’s not the only reason but definitely don’t be afraid to submit for other trades, they stand as much a chance to do well!
Number of Submissions
Note: The first time a theme was introduced was in 2018, marking a noticeable decline in submission volume.
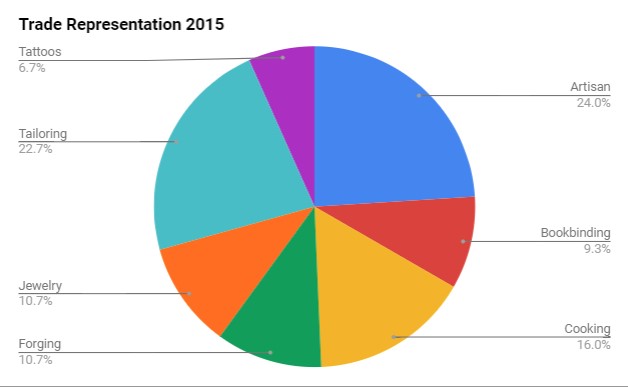
Trade Representation by Year
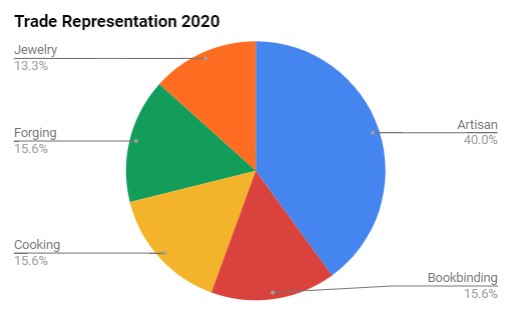
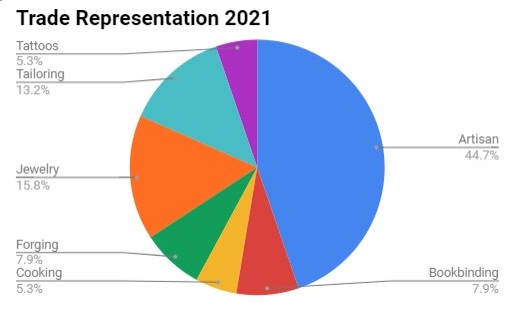
Trade Placement Overview
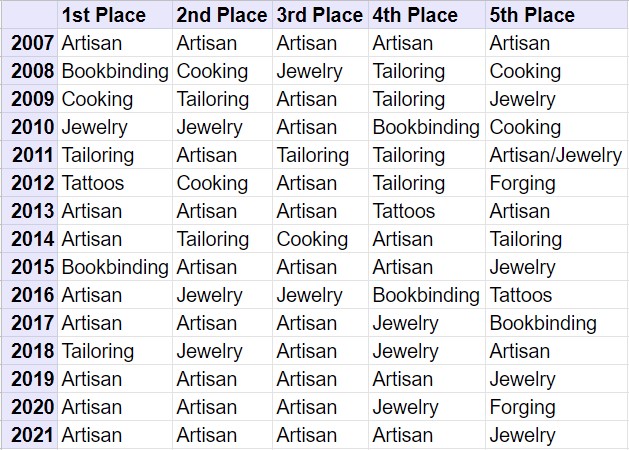
Top Placement per Trade
